How to Prepare a Monthly Business Report
This blog will act as a guideline on how to prepare a monthly business report in Excel for a comprehensive analysis of business performance.

1. Begin With a Financial Summary
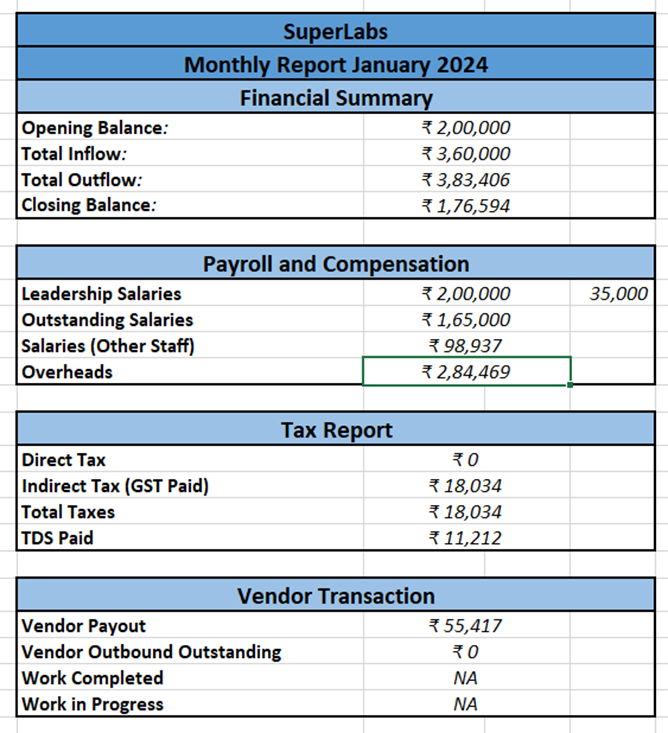
Start by pulling data from the bank statement and master ledger. Your goal here is to establish a clear picture of the cash position of the company. Begin by identifying the Opening Balance—this is the closing balance from the previous month (February, in our case, ₹2,00,000). Then, total up all the inflows (credits) and outflows (debits). For March, we recorded a total inflow of ₹3,60,000 and an outflow of ₹3,83,406, leading to a Closing Balance of ₹1,76,594. Always ensure these numbers match between the ledger and the bank statement. These four figures—opening balance, inflow, outflow, and closing balance—should be clearly stated at the top of your report to set the context
First, we need to summarize the cash movement for the month.
Look at the bank statement and master ledger (refer to the first and second images):
From those, extract:
- Opening Balance → This was ₹2,00,000 (closing balance from February).
- Total Inflow → ₹3,60,000 (sum of all credit entries).
- Total Outflow → ₹3,83,406 (sum of all debits).
- Closing Balance → ₹1,76,594 (you can also calculate this: Opening + Inflow – Outflow).
Put this into the report like so:
|
Opening Balance |
₹ 2,00,000 |
|
Total Inflow |
₹ 3,60,000 |
|
Total Outflow |
₹ 3,83,406 |
|
Closing Balance |
₹ 1,76,594 |
2. Compile Payroll and Salary Details
Next, gather data from the payroll records. Break the salaries into two categories: Leadership Salaries and Other Staff Salaries. For March, Balachande, our Managing Director, had a salary component of ₹2,00,000, out of which ₹35,000 was disbursed (₹15,000 incentive and ₹20,000 leadership payout). Adarsh received ₹50,764, and Tomojit ₹48,173, summing to ₹98,937 in staff salary outflows. Also, be sure to note any Outstanding Salaries that have been accrued but not yet paid. For March, this amounted to ₹1,65,000. Present this part of the report in a way that separates what's paid from what's pending.
Now we move on to salary and compensation. Look at the Employee Payroll snapshot (last image):
From there:
- Leadership Salaries were ₹2,00,000 total, with ₹35,000 actually paid this month (15,000 + 20,000 for Balachande).
- Other Staff Salaries:
- Adarsh: ₹50,764
- Tomojit: ₹48,173
Total = ₹98,937
3. Calculate Overheads and Taxes
We then move to overheads and taxes. Refer to the Overheads Sheet for this. List each cost category—like office furniture, electricity, software license—and total them up. For March, overheads summed to ₹2,84,469. From the tax summary, note that Direct Tax was ₹0, while Indirect Tax (GST Paid) was ₹18,034. Additionally, TDS Paid for the month was ₹11,212. All tax components must be totalled and shown separately. This gives clarity on tax compliance and its impact on cash flow.
Refer to the Overheads Table and Tax Summary (TDS + GST).
From the overhead
- Office Chair: ₹23,142
- Rent & EB: ₹38,096
- Software: ₹31,382
- Total Overheads: ₹2,84,469
- Indirect Tax (GST Paid) = ₹18,034
- TDS Paid = ₹11,212
- Direct Tax = ₹0
4. Summarize Vendor Payments
In the vendor payment section, document all payouts made to vendors. For March, the primary vendor payout was ₹55,417 to Kavita M for HR consulting services. Also, verify and note any outstanding vendor payments—in March, there were none. You should also flag if any work has been completed or is in progress but unpaid; however, for this month, both were marked as NA (Not Available).
Use the Vendor Outbound Payment sheet:
- Paid: ₹55,417 to Kavita M (HR Consulting)
- Outstanding: ₹0
|
Vendor Payout |
₹55,417 |
|
Vendor Outbound Pending |
₹0 |
|
Work Completed |
NA |
|
Work in Progress |
NA |
5. Detail Customer Payments Received
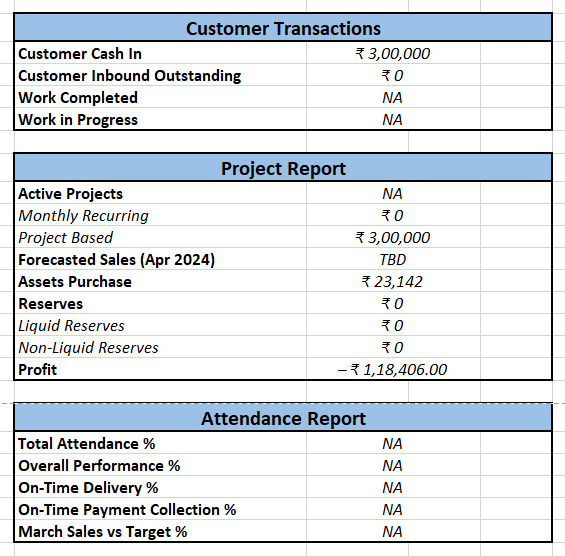
Shift your focus to customer receipts. Refer to the Customer Inbound Payment table and the bank statement to confirm figures. For March, we received ₹2,00,000 from Guru Subra and ₹1,00,000 from Tech Ventures Pvt Ltd, totalling ₹3,00,000 in customer cash inflows. Also, note whether there are any outstanding dues or in-progress projects for which payment is pending. In this case, there were no customer receivables or partially fulfilled contracts.
Check the Customer Inbound Payment table:
- Guru Subra: ₹2,00,000
- Tech ventures: ₹1,00,000
Total = ₹3,00,000
Outstanding = ₹0
|
Customer Cash In |
₹3,00,000 |
|
Customer Outstanding |
₹0 |
|
Work Completed |
NA |
|
Work in Progress |
NA |
6. Update Project and Sales Forecast
In this section, list the active projects and classify them as monthly recurring or project-based. In March, SuperLabs had no recurring projects, but it undertook two project-based ones with a combined value of ₹3,00,000. Also, if available, note the forecasted sales for the next month—in this case, April 2024 was still marked as TBD (To Be Determined). This section should also track the progress of relevant projects.
From the March Summary Sheet:
- No monthly recurring projects.
- Project-Based: ₹3,00,000 (from Tech ventures and Guru Subra)
- Forecasted Sales for April: TBD (to be updated by Sales)
|
Active Projects |
|
|
Monthly Recurring |
₹0 |
|
Project-Based |
₹3,00,000 |
|
Forecasted Sales (Apr) |
TBD |
7. Report on Capital Expenditure and Reserves
If the company made any capital asset purchases, document them here. For example, in March, ₹23,142 was spent on office furniture. Reserves—both liquid (cash equivalents) and non-liquid (assets)—should also be tracked. For March, both types of reserves stood at ₹0. This section helps management understand the level of buffer or fallback they have in case of an emergency or unforeseen investment needs.
8. Performance Metrics (Optional but Useful)
Towards the end of your report, include KPIs such as total attendance percentage, on-time delivery, on-time payment collection, and monthly sales performance versus targets. These figures are usually collected from the HR and Project Management teams. In March’s report, these values were not available (NA), but they’re crucial for understanding operational efficiency and team productivity when filled out.