Improvements in operational efficiencies on 1MDM with automation
Improving operation efficiency using automation.

Currently 1MDM utilizes staff to manually input thousands of product data to their console. The process involved was as follows:
- Manually collect product information across various online platforms - Save the product information on the local hardware in proper formats for images and information
- Convert images to proper format if the images weren’t in the proper format (.webp to PNG)- Upload all data points to console individually
- Upload all relevant images for each product individually
Then it allows a separate QA team to verify all the uploaded information before finally pushing it to production.
Their team had 8 full-time employees and 1 part-time employee - out of those the 1 part-time and 3 full-time employees were allocated to exclusively complete product upload targets. 5 full-time employees were also dedicating one working day of the week to exclusively work on 1MDM product uploads. On the quality assurance team were 2 dedicated full-time employees working exclusively to verify the accuracy of product data, images and various data points and ensure sync.
Below is a visualization of the same:
*The full-time employees were working 8 hours a day, 6 days a week i.e. 48 hours a week.
The part-time employees were working 4 hours a day, 6 days a week i.e. 24 hours a week.
The selective full-time employees were working 8 hours a day, 1 day a week i.e. 8 hours a week.
Problems in the current way of things
With their current way of functioning, to complete 10,000 product uploads & verification, the team would have taken approximately 3 to 5 months where they would be simultaneously working on gathering, uploading and verifying product data. The process was tedious and allowed a maximum of 120 products per day per employee to be uploaded for verification and around 200 products per day to be verified. However, in real-world scenarios, the statistics vastly differed where employees had sometimes uploaded as low as 50 products a day.
Below are highlights of projected vs actual work efficiencies in April 2022:
Projected work performance:

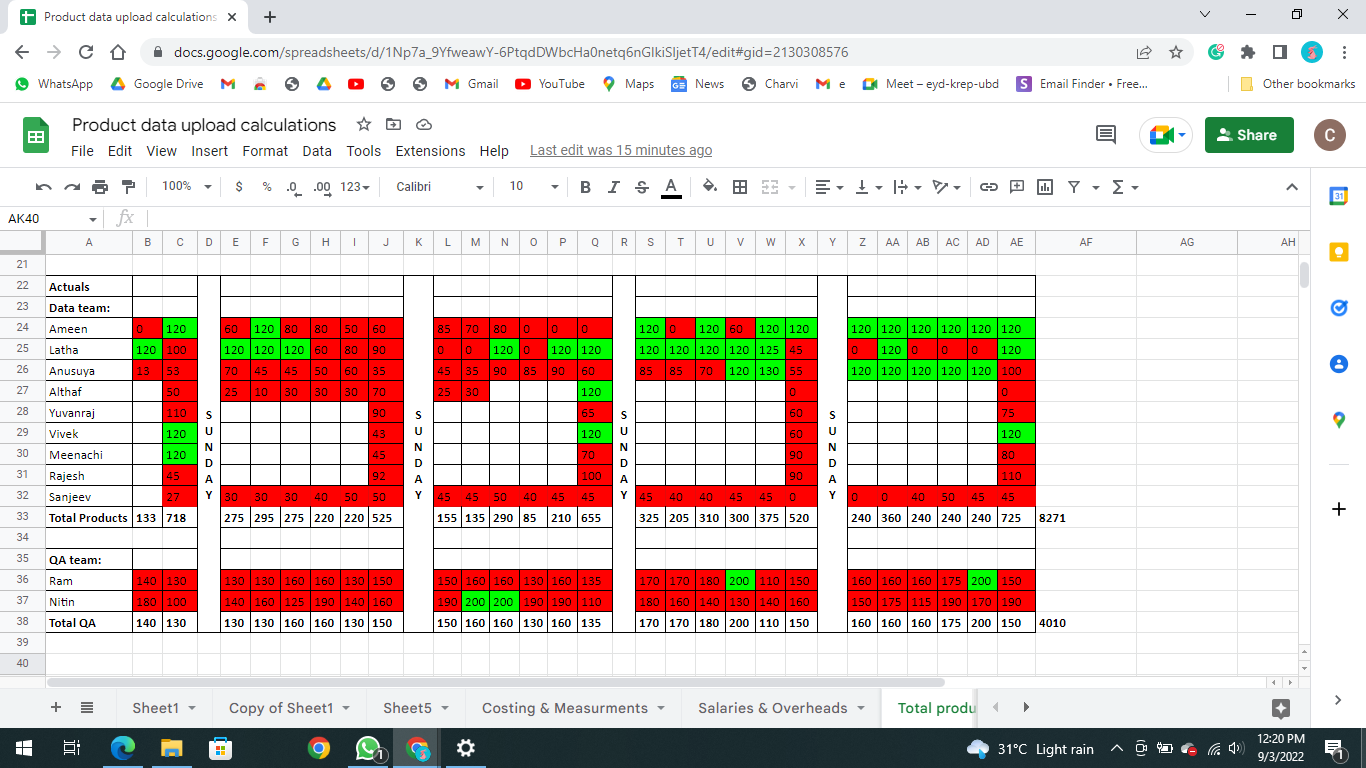
As visible above, there were huge inconsistencies in the QA and data upload speeds of each employee, while some were able to complete their theoretical maximum, others failed on a consistent basis. The other major problem the company faced during this process was that the QA team and production team were uploading data in excel formats ( .xlsx) to the website dashboard. The product uploading team had made errors in compiling the new product data from various employees and the product information visible on the site was incorrect.
Below are depictions of errors made by the product uploading team when working manually:
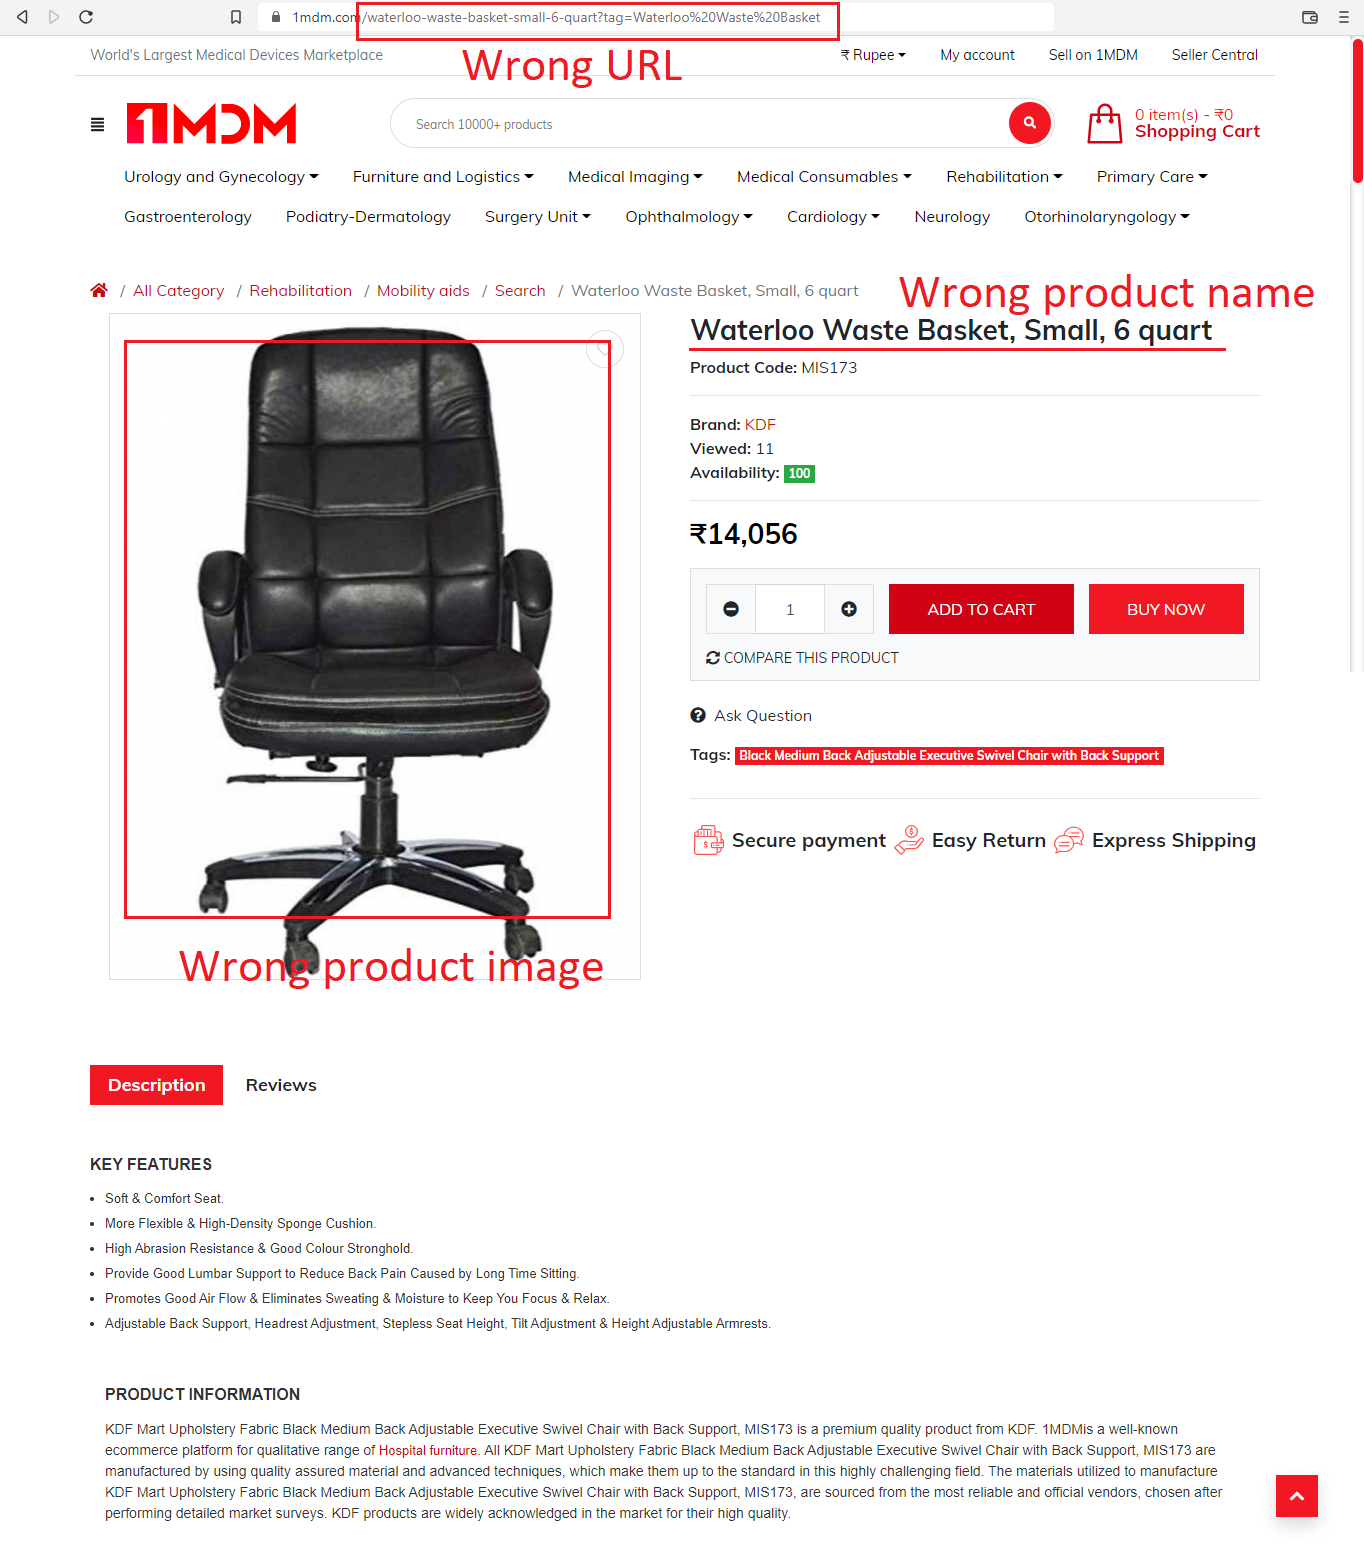
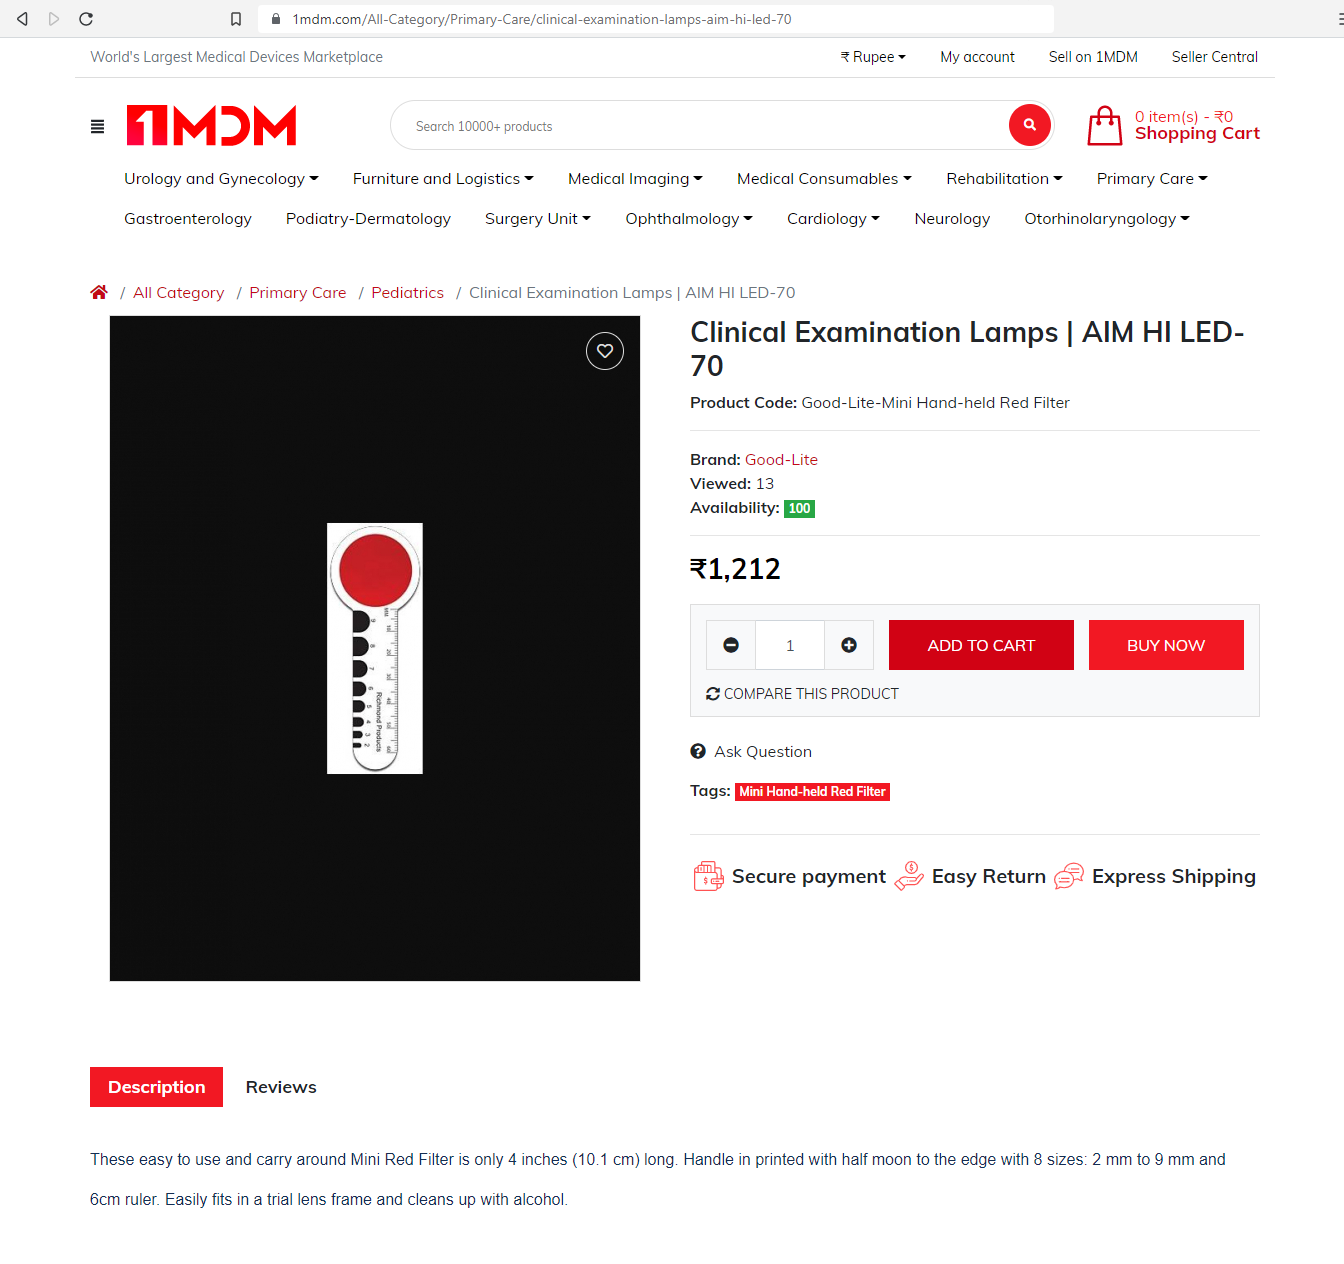
This was a massive problem as they were losing new potential customers every day with each product upload.
Measurement metrics
We took the following 4 core metrics to be measured while evaluating the existing process and building the solutions:
- Time to identify relevant product
- Time to download, store and convert product information into relevant format
- Time to upload product information & images with proper data
- Time to cross verify product and perform QA
Old Outcomes
The time and cost incurred per product as per the old process are as follows:
Each product cost an average of INR 98.72 in money and 384 seconds in time to be live on the 1MDM website.
The above numbers are derived based on the following old process efficiencies:
Old expenditures & outlays
The cost parameters involved in the previous process were:
Employee salaries - INR 165,000 monthly Overheads - INR 35000 monthlyTimeline to complete goals - 3-5 months Total estimated cost - INR 6,00,000 - 10,00,000
Proposed solution
Deployment of data scraping & automation
With the new process we built a product data scraper that allowed for the required data to be scrapped automatically.
The scrapper ran on two different servers, one ran the computational algorithm to download the data and another low-cost object storage was used to save information, which can also be used to upload data directly to the production servers.
As a result, all the mentioned processes were accomplished in a matter of weeks. The initial process of choosing an online platform was done manually but processes such as storing information and uploading the data into the production servers were automated with minimal manual intervention. We took a sample data size of 500 products to test the accuracy of the process. After seeing success with it, we dived into the full data set of 10,000 products. As there was minimal human intervention, the process of QA was altogether removed since errors were also non-existent, but data was sampled randomly to ensure information was presented correctly. Not just that, even product URLs were automatically created and saved hundreds of man hours on the task.
New Outcomes
Massive changes were observed in the measurement metrics after the implementation of data automation.
The time and cost incurred per product after implementation of the new product data scraper are as follows:
Each product costed an average of INR 2.31 in money and 23.04 seconds in time to be live on the 1MDM website.
The above numbers are derived based on the following new process efficiencies:
New expenditures & outlays
The cost parameters involved in the new process were:
Employee salary for 8 days - INR 12,308Overheads for 8 days - INR 215
Timeline to complete goals - 8 daysTotal estimated cost - INR 23,076
Change in outcome
Below is a comparison of the change in metrics and improvement in overall efficiencies in the old time/cost vs the new time/cost that were observed:
An overall cost decrease of 96.54% was achieved along with a 91.11% decrease in overall time consumed.
Additional benefits
- Market validation
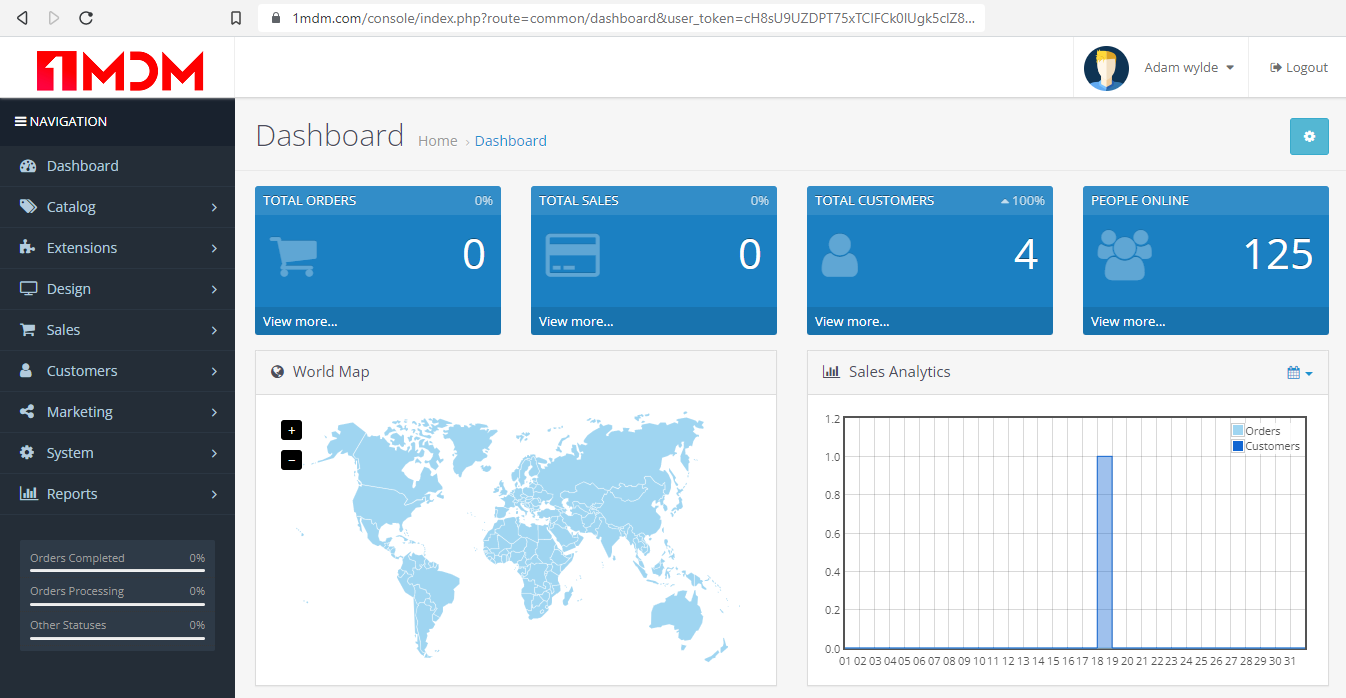
The accuracy of product information led to a steep rise in the number of users browsing the website at any point in time. 125 users found their way to the 1MDM website organically due to the large data sets presented accurately.
Below is a visual of the same:
- Organic growth in website traffic
A significant increase in website traffic was observed from the addition of new data. Consistent growth was seen in the number of users, sessions, page views and session durations. The addition of highly accurate data helped decrease the bounce rate significantly. The average time spent on the website by each visitor went from 0 to approximately 11 minutes, within a span of 30 days, organically.
The platform transitioned from stagnation to growth phase after the implementation of the new process. The website saw a continuously increasing interest from 6+ countries including the USA, China, New Zealand, Brazil, India, and others who had collectively made around 13,000 impressions out of which 12,000 were in the past month (July) itself.
Below is a visual of the same:

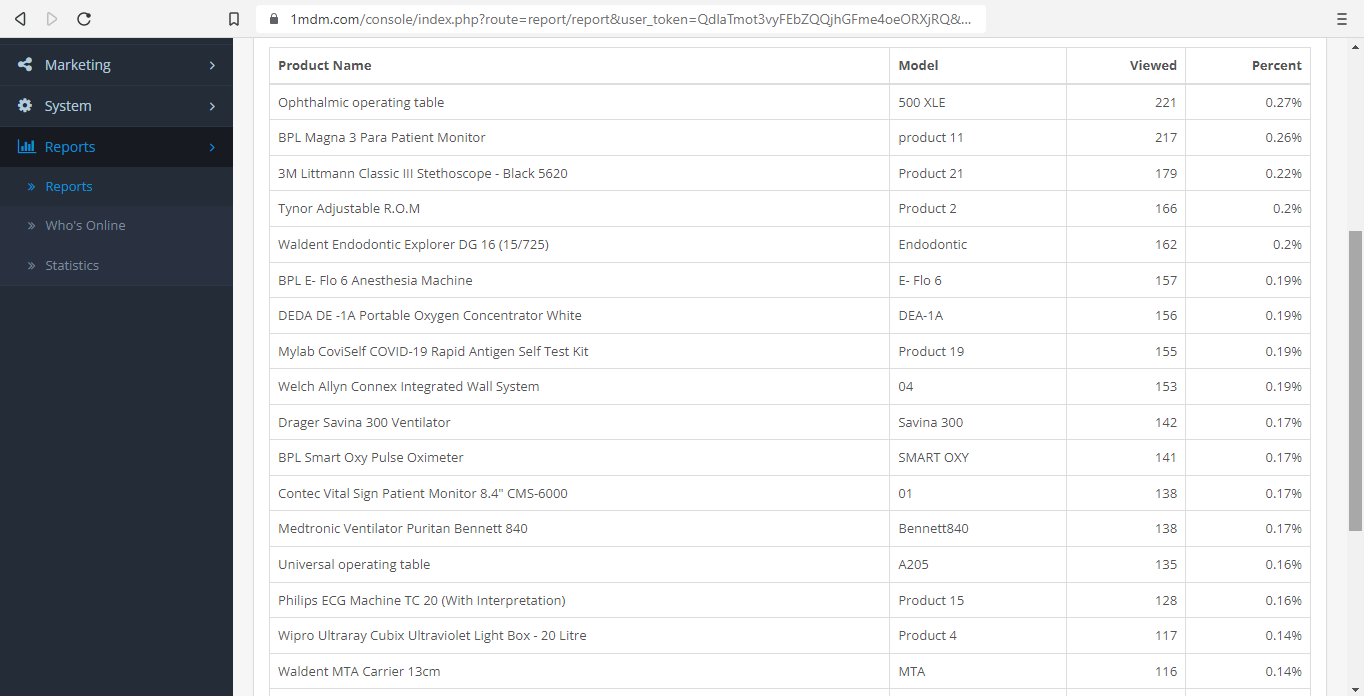
- Products viewed report
Being able to upload huge sets of data in a fast turnaround time helped the team analyze the right target audience and collect the right data points in the market. It helped them identify user needs and focus on adding relevant data to the website in a short span of time to dive deeper into the market.
An insight into the user journey revealed that users were continuously exploring the product data as and when additions were made to the website. Fast turnaround time in making huge sets of data uploads served as a critical benchmark in gauging the interest of the users and retaining them on the website.
- Trust
Produce trust on the platform for users who are searching for information in the medical devices sector by showcasing accurate product data, unbiased reviews & multiple options of the same product from various manufacturers.
ConclusionIn order to improve processes, key metrics are important to assess. Assessing key metrics gives an insight into how the current tasks are being achieved. While the theoretical estimation of the timeline was 20 to 30 days, several factors negatively affected the achievement of those results in the real world.
These hindrances led the team to be trapped in a 3 to 5 month timeline which directly impacted factors like time and costs eventually taking a hit on their efficiency. As new processes involving automation were implemented, human error was minimized to nearly zero which became a key factor in achieving the desired results. The cost spent in the short run was higher but the overall cost & time spent to achieve the results were greatly reduced. Maximum operational efficiency was achieved for the entire team after the implementation of the new process. The team is much more confident now and is moving to a larger data set of 50,000 products. As per the old processes, it would have taken them 5 months to achieve it. In the real world, the time taken would have been much longer and would have also borne multiple inverse effects from human intervention. Overall, the success metrics were achieved within the planned timelines and have had a net positive effect on the platform as a whole. With the new process, the company was able to save over 10,00,000 to 17,00,000 rupees in cost and 5 to 13 months in time with each instance of adding product data.