Clicks to Revenue - eCommerce analytics
Understanding clicks, driving conversion, revenue & growth in eCommerce
Essential E-commerce Analytics
E-commerce analytics extend far beyond simple sales tracking; they represent the strategic foundation for comprehending customer behavior, streamlining operational processes, and fostering enduring growth. Lets review the delineates critical metrics across financial performance, customer journey, customer retention, product performance, and technical website/app performance. We underscores the imperative of translating raw data into actionable strategies. By concentrating on key performance indicators (KPIs) and employing sophisticated methodologies such as audience segmentation and real-time analytics, organizations can significantly enhance user experience, elevate conversion rates, and cultivate profound customer loyalty.
The Strategic Imperative of E-commerce Analytics
In the intensely competitive digital marketplace, e-commerce entities must transcend rudimentary reporting to adopt a sophisticated, data-driven methodology. Robust analytics confer a distinct competitive advantage, enabling businesses to swiftly adapt to market shifts and address evolving customer demands.1 This process involves not merely the collection of data, but its active interpretation and strategic application to inform decisions that propel growth.1 The overarching objective is to transform quantitative information into practical strategies, thereby improving outcomes across all facets of the business, from marketing return on investment (ROI) to customer satisfaction.1
A closer examination of the analytical landscape reveals a significant evolution from reactive analysis to proactive optimization. Initially, many businesses commence their analytical efforts by reviewing basic sales reports, primarily reacting to past performance trends. However, the progression in analytics tools and methodologies facilitates a deeper understanding of the underlying causes of observed phenomena.2 This advancement permits the anticipation of future customer actions and market dynamics, a capability significantly augmented by advancements in machine learning and artificial intelligence.3 The ability to predict future behavior enables proactive optimization, such as the implementation of dynamic pricing models, the launch of precisely targeted marketing campaigns, or real-time inventory adjustments.4 This strategic foresight directly contributes to improved ROI and a heightened competitive posture. The broader implication of this strategic shift is the transformation of e-commerce from a transactional model into a profoundly customer-centric and adaptive ecosystem, where every operational and strategic decision is continuously refined through empirical data.
I. Core Financial & Sales Performance Metrics
A comprehensive understanding of an e-commerce business's financial health is paramount. The metrics discussed in this section offer a clear depiction of revenue generation, profitability, and the efficiency with which investments yield returns.
Sales Volume quantifies the total amount of sales generated by the business over a specified period, which can be measured either in units sold or their monetary value.5 The calculation for this is straightforward: Sales volume = units sold × price per unit.5
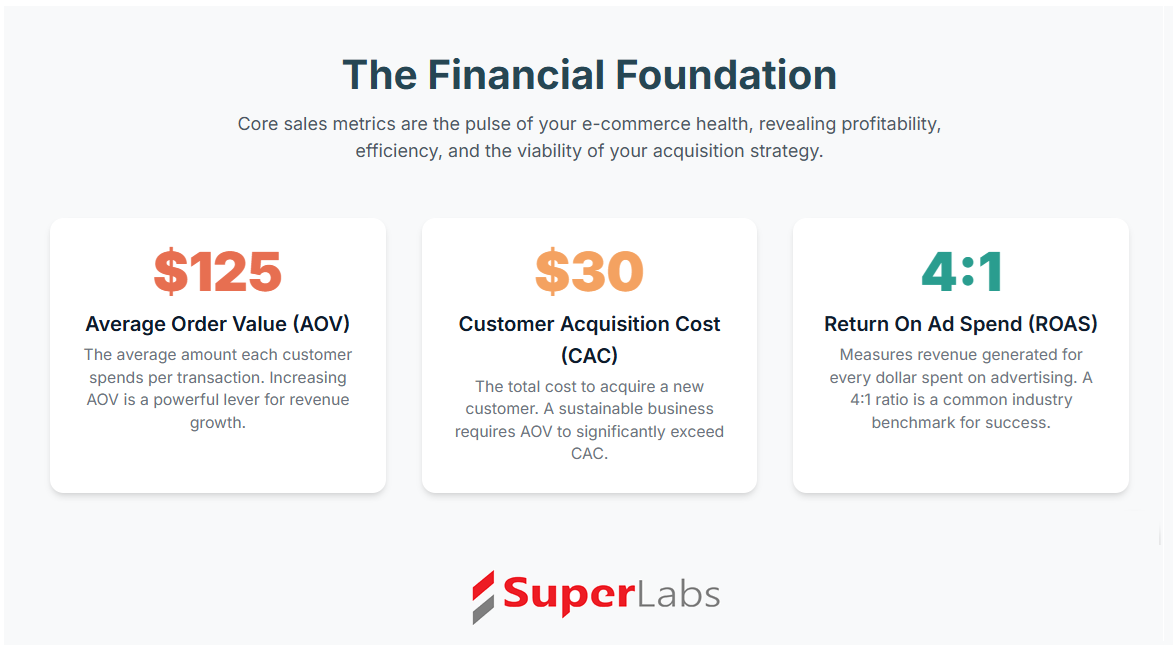
Average Order Value (AOV) represents the average monetary amount a customer spends on each purchase.5 It is calculated by dividing the total sales by the number of orders: AOV = total sales / number of orders.5 A primary focus for businesses is to increase AOV, as this can significantly boost revenue without necessitating an increase in website traffic. Common strategies for achieving this include recommending related items, offering discounted accessory items, or providing free shipping for orders exceeding a certain monetary value.6
Gross Margin or Gross Profit indicates the profit a business makes after deducting the Cost of Goods Sold (COGS) from its revenue.5 The formula for Gross Margin is revenue - COGS 5, while Gross Profit is Total revenue – Cost of goods sold (COGS).6 A robust gross profit margin is a fundamental indicator of the profitability of products before accounting for operating expenses, signaling sustainable growth potential.6
Net Profit represents the ultimate financial success of a business, calculated after all expenses, including COGS, marketing, and operational costs, have been accounted for.5 The formula is Net profit = revenue - expenses 5, or Net profit = Total revenue – Total expenses.6
Return on Investment (ROI) quantifies the profit or loss generated from an investment, expressed as a percentage.5 It is calculated as: ROI = (net profit / cost of investment) × 100 5, or ROI = Net return or income on investment / Cost of investment × 100.6 This metric is crucial for evaluating the effectiveness of significant investments, new business strategies, or marketing campaigns.6
Return on Ad Spend (ROAS) is a specific measure of the revenue generated from advertising investments.6 The formula is: ROAS = Revenue from advertising investment / Cost of advertising.6 A common benchmark for e-commerce ROAS is 4:1, indicating $4 in revenue for every $1 spent on advertising.6
Cost Per Acquisition (CPA) and Customer Acquisition Cost (CAC) measure the expense incurred to acquire a new customer.3 CPA typically focuses on direct campaign costs, while CAC encompasses a broader range of expenses, including marketing, sales, and even product development.3 The formulas are: CPA = total marketing and sales expenses / number of new customers 5, or CPA = Total spent on campaign to acquire new customers or users / New customers or users acquired.3 For CAC, it is total spend / number of new customers 5, or CAC = Total marketing and sales expenses / Number of customers acquired.3 Optimizing CPA/CAC is critical to prevent overspending on ineffective channels 3, as a low CAC signifies efficient customer acquisition.
Gross Merchandise Volume (GMV) represents the total revenue derived from all merchandise sold over a specific period.6 It is calculated as: GMV = Sales price of product/service × Number of products/services sold.6 While useful for understanding overall transaction volume, particularly in marketplace models, GMV does not directly reflect profitability.
Average Profit Per Customer quantifies the average profit a company generates from each customer.6 The formula is: Average profit per customer = Total profits in a period / Number of customers in that period.6 This metric provides valuable insight into the maximum amount a business can afford to spend on customer acquisition.6
Revenue Per Site Visitor measures the gross revenue generated per visit to the website.6 It is calculated as: Revenue per site visitor = Total revenue in a period / Website visits in period.6 This metric helps assess the efficiency of website traffic in converting into sales.
The interplay between acquisition costs and profitability is a critical consideration. When a business experiences a high CPA or CAC combined with a low AOV or Average Profit Per Customer, it indicates an unsustainable business model, where the cost of acquiring customers outweighs the value they generate. This relationship directly influences strategic decisions concerning marketing budget allocation 3, pricing strategies, and product bundling 6 aimed at increasing AOV. Improving CPA 3 or increasing AOV 6 directly enhances net profit and elevates ROI. This also connects to Customer Lifetime Value (CLV), as a higher CLV can justify a higher CAC.7
Table 1: Essential E-commerce Sales & Financial KPIs with Formulas and Benchmarks
II. Customer Journey & Conversion Funnel Analytics
Understanding the precise manner in which customers interact with a website or application, from initial discovery to the final purchase, is fundamental for optimizing the user experience and maximizing conversion rates.
A. Acquisition & Engagement Metrics
These metrics provide critical data on how users initially find an e-commerce platform and their subsequent preliminary interactions.
Site Traffic refers to the total number of visits to a website within a specified timeframe.6 It is typically monitored on a week-over-week, month-over-month, or year-over-year basis to track growth trends.6
Traffic Source identifies the channels through which online visitors discover a website.6 These sources commonly include organic search, paid search advertisements, social media platforms, direct navigation (typing the URL), email marketing campaigns, and affiliate referrals.6 Analyzing traffic sources is instrumental in making informed marketing investment decisions, as it reveals which channels are most effective in attracting revenue-generating customers.6
Sessions by Device categorizes visitors based on the type of device they use to access the store, such as desktop computers, tablets, or smartphones.8 This metric is crucial for prioritizing user experience optimization efforts, especially for mobile devices, which now account for over 50% of all e-commerce traffic.8
Sessions by Location provides geographical data on the origin of website sessions, detailing the country, city, or region.8 This information enhances understanding of customer demographics and enables businesses to tailor communication strategies, campaigns, or logistics to specific regional preferences.8
Time on Site or Average Session Duration measures the average length of time a visitor spends on a website.3 A longer duration generally indicates higher visitor engagement and a greater likelihood of a purchase.3 Conversely, a low time on site suggests a need to improve product pages or navigation to keep visitors engaged.3
Pages per Session tracks the number of individual pages a visitor views during a single browsing session.3 A higher number of pages per session often signifies a deeper interest in the product catalog. If this metric is low, it suggests opportunities to improve internal navigation or to bundle related products for easier discovery.3
Bounce Rate is the percentage of visitors who access a website but leave after viewing only a single page.3 The formula for Bounce Rate is: Number of one-page website visits in a period / Total number of website visits in a period.6 The average bounce rate for e-commerce websites typically ranges between 20% and 45%.8 A high bounce rate points to underlying issues such as poor-quality traffic sources, a mismatch between ad promises and landing page content, a poorly designed user experience (UX), or technical problems.3
Click-Through Rate (CTR) measures the percentage of users who click on a specific link relative to the total number of times the link was displayed (impressions).8 The calculation is: CTR = Total number of clicks ÷ impressions.8 A low CTR may indicate that the messaging is not sufficiently compelling to attract user clicks.
The presence of low Time on Site, few Pages per Session, and a high Bounce Rate 3 often indicates a significant problem. These engagement metrics are direct consequences of the quality of incoming traffic and the relevance and usability of the landing page. If traffic sources are misaligned—for instance, if advertisements promise one thing but the landing page delivers another 3—or if the initial user experience of the site is inadequate 8, visitors are likely to depart quickly. This directly impacts customer acquisition costs (CPA/CAC) and overall conversion rates. Effectively, businesses may be expending resources to attract visitors who do not engage, leading to wasted advertising spend and diminished ROI.3 This situation signals an urgent need for A/B testing on landing pages, refining advertising targeting 1, and enhancing the initial user experience.1
B. Conversion Funnel Metrics
These metrics are essential for tracking the progress of users through the sales funnel, from their initial expression of interest to the completion of a purchase.
Conversion Rate (CVR) represents the percentage of website visitors who complete a desired action, most commonly making a purchase.3 The formula is: CVR = (number of conversions / number of visitors) × 100 5, or CVR = Total desired action by visitors / Total visits × 100.6 A common benchmark for e-commerce sales CVR is between 2% and 3%.6 A higher CVR indicates that the messaging, product selection, and user experience are effectively resonating with the target audience.3
Conversion Rate by Channel tracks the performance of different marketing channels in driving conversions.6 It is calculated as: Total conversions derived from a marketing channel / Total visits from marketing channel × 100.6 This metric is invaluable for allocating marketing budgets efficiently across various channels.6
Add-to-Cart Rate measures the percentage of site visitors who add products to their virtual shopping cart.6 The formula is: Add-to-cart rate = Total website sessions where visitor adds products to cart in a specific time period / Number of total visitor website sessions during period × 100.6 This metric serves as an early indicator of initial product interest.
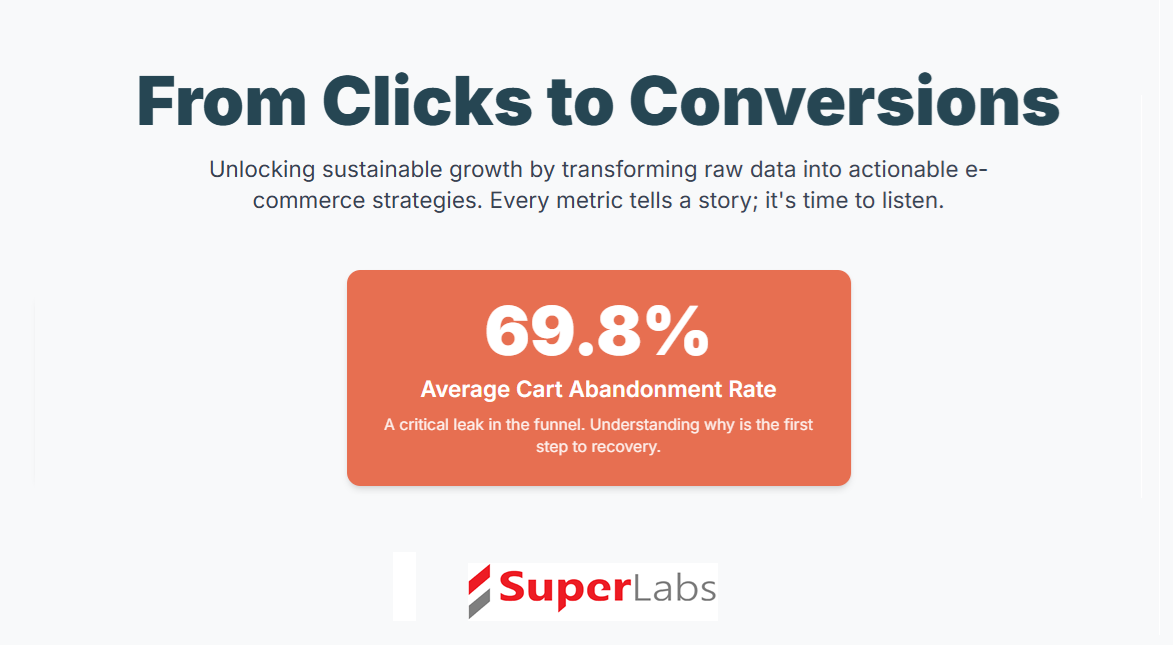
Cart Abandonment Rate quantifies the percentage of shoppers who add items to their shopping cart but then leave the website without completing the purchase.3 The calculation can be performed as: Cart abandonment rate = ((Total number of carts created – Number of completed purchases) / Total number of carts created)) × 100.11 Another method is: 1 – Completed purchases / Number of carts abandoned before checkout × 100.6 Alternatively, it can be calculated as 100 − (Number of completed purchases ÷ by number of shopping carts created × 100).8 Studies suggest an average abandonment rate of approximately 69.80%.8 A high abandonment rate often points to issues within the checkout process, such as complex navigation, insufficient payment options, unexpected additional costs (e.g., shipping, taxes), security concerns, or mandatory account sign-up requirements.3
Checkout Flow Completion Rate measures the success rate of users in completing each step of the checkout process without dropping off.11 The formula is: Checkout flow completion rate = (Number of successful checkouts / number of checkouts initiated) × 100.11 This metric is critically important for e-commerce, as it directly correlates with how effectively an application or website converts interested users into paying customers by identifying friction points within the funnel.11
Error Rate (for apps) refers to the frequency with which users encounter errors while using an application, including crashes, failed transactions, loading errors, or broken links.11 The formula is: Error rate = (Number of sessions with errors / total number of sessions) × 100.11 High error rates can lead to user frustration, erode trust in the application and brand, and result in lower customer retention and sales.11 Maintaining a low error rate is essential for a seamless user journey.
Orders Per Active Customers indicates the number of orders placed by "active" customers within a given period.6 An "active" customer is typically defined as one who has made at least one purchase within a set timeframe, often one year.6 The formula is: Orders per active customers = Number of orders by all active customers / Number of active customers.6 This metric provides insight into how effectively a company cultivates customer loyalty and drives repeat purchases.6
A high Cart Abandonment Rate 8 or a low Checkout Flow Completion Rate 11 signals a critical issue within the conversion funnel. The immediate question arising from such observations is why customers are disengaging at these crucial junctures. These metrics are direct indicators of friction within the user experience (UX). Common causes include unexpected shipping costs, mandatory account creation, overly complex forms, or concerns regarding payment security.8 Technical errors 11 can also be a significant contributing factor. Each drop-off point within the funnel represents a direct loss of potential revenue. By meticulously analyzing these specific stages—for instance, through session replays and heatmaps provided by tools like UXCam 11—businesses can precisely identify the pain points. Addressing these issues, such as simplifying the checkout process, offering guest checkout options, ensuring transparent pricing, or implementing retargeting campaigns 8, directly enhances conversion rates and recovers sales that would otherwise be lost. This highlights that conversion optimization is not solely about attracting users but equally about systematically removing obstacles for those who have already demonstrated interest.
Table 2: Key Customer Journey & Funnel Metrics with Insights
III. Building Lasting Relationships: Customer Retention & Loyalty Metrics
Retaining existing customers is consistently more cost-effective than acquiring new ones. These metrics are fundamental for assessing the long-term health of a customer base and the strength of customer loyalty.
Customer Lifetime Value (CLV), also referred to as Customer Lifetime Value (CLTV), represents the total monetary amount a customer is projected to spend throughout their entire relationship with a business.5 It can be calculated using various methods, such as: Company's average order value × Purchase frequency for an average customer per period × Number of periods average customer remains a customer.6 Another common formula is: Average value of customer (monthly or annual basis) × Average customer lifespan.13 This metric is crucial for understanding the long-term value of an average customer, which in turn helps justify customer acquisition costs and guide resource allocation decisions.6
Customer Retention Rate measures the percentage of customers who continue to engage with a company over time.5 A common formula is: (Number of customers at close of a period – Number of customers acquired during period) / Customers at beginning of period) × 100.6 Another formulation is (E-N/S) × 100, where E represents end customers, N signifies new customers, and S denotes starting customers.16 E-commerce brands typically average around 30% customer retention, with rates below 25% often signaling a problem.16 A high retention rate directly contributes to increased profits, as it is generally less expensive to generate revenue from repeat purchasers than to acquire new ones.6
Customer Churn Rate is the inverse of the retention rate, representing the percentage of customers who cease doing business with a company over a specified period.5 It is calculated as: (Number of customers lost during period / Total number of customers at beginning of period) × 100 5, or (number of customers churned in a month / total number of customers at the start of the month) × 100.13 A consistent increase in churn rate often indicates underlying issues with the product or user experience.13
Annual Repurchase Rate tracks how many customers continue to place orders year after year.6 The formula is: Number of customers who made purchases in both current year and prior year / Customers who made purchases in current year × 100.6 A benchmark of over 60% suggests a business is in "retention mode," while rates below 40% indicate an "acquisition mode" focus.6 This metric is particularly crucial for businesses selling consumable goods or in B2B sectors, as it strongly correlates with customer service quality, loyalty, and engagement.6
Repeat Purchase Rate (RPR) measures the percentage of customers who make more than one purchase.12 The formula is: RPR = (Number of customers who purchased more than once) ÷ (total number of customers) × 100.13 This serves as a direct indicator of customer loyalty and how well products align with customer expectations.13
Time Between Purchases (TBP) reveals how quickly customers are inclined to make subsequent purchases.16 It is calculated as: TBP = (Sum of individual purchase frequency by days ÷ number of repeat customers).16 This metric assists in predicting future purchases and optimizing re-engagement campaigns.
Net Promoter Score (NPS) quantifies the likelihood of customers recommending a business to others.3 The basic formula is: NPS = Percentage of surveyed customers who are "promoters" – Percentage of surveyed customers who are "detractors".6 A more detailed calculation involves: (Number of promoter scores ÷ total respondents) – (Number of detractor scores ÷ total respondents) = Answer × 100 = %.16 A high NPS suggests that the business is exceeding customer expectations and successfully building strong relationships.3
Customer Satisfaction Score (CSAT) measures the degree of satisfaction customers have with products or services.3 It can be calculated as: CSAT = (Number of 4 and 5 responses) ÷ (Number of responses) × 100 13, or (number of positive responses / total responses) × 100.12 Monitoring this score over time helps to gauge the impact of improvements on customer happiness.3
For subscription-based models, Monthly Recurring Revenue (MRR) represents the total recurring revenue, while Revenue Churn Rate indicates the proportion of MRR lost.13 The Revenue Churn Rate formula is: { / MRR at the beginning of the month} × 100.13 This metric is crucial for understanding the financial impact of churn, particularly for businesses relying on recurring revenue.
Reactivation MRR and Reactivation Rate track the recurring revenue generated from previously churned customers who have returned, and the percentage of churned customers who eventually reactivate, respectively.13 These metrics assess the effectiveness of win-back campaigns.13
Cumulative Cohort Revenue (CCR) represents the total revenue earned from a specific group of customers acquired within a defined period, typically compared against their Customer Acquisition Cost (CAC).13 This provides clear insight into when CAC is recouped and whether acquisition efforts are becoming more efficient over time.13
Daily/Weekly/Monthly Active Users (DAU/WAU/MAU) are behavioral analytics metrics that indicate the level of active product usage among customers.13 Monitoring these metrics helps identify declines in engagement that often precede churn. Establishing activity benchmarks and proactively re-engaging users who do not meet them can prevent churn.13
For subscription services, the Renewal Rate tracks the percentage of customers who choose to renew their contracts.13 This provides direct insight into retention success, especially when monitored by customer segment.13
Finally, Customer Revenue Growth Rate indicates how much more—or less—revenue existing customers are generating over time.13 The formula is: ((Revenue from existing customers in the current period - Revenue from existing customers in the previous period) / Revenue from existing customers in the previous period) × 100.13 This serves as a vital indicator of customer loyalty and engagement, and it helps gauge the effectiveness of upselling and cross-selling efforts.13
The principle that acquiring new customers is more expensive than retaining existing ones 2 is a cornerstone of sustainable e-commerce growth. A high Customer Retention Rate 6 and Repeat Purchase Rate 13 directly lead to a higher Customer Lifetime Value (CLV).6 This means that each customer contributes a greater profit over the duration of their relationship with the business, thereby justifying initial marketing expenditures and enhancing overall profitability.6 Investing in superior customer service, implementing loyalty programs 6, and delivering personalized experiences 1 to improve retention metrics such as NPS and CSAT 3 creates a compounding effect on revenue. Satisfied, loyal customers not only make more purchases but also become brand advocates, driving organic growth and reducing future Customer Acquisition Costs (CAC).3 This strategic emphasis shifts the business focus from a singular transaction to cultivating a long-term, mutually beneficial customer relationship.
Table 3: Customer Retention & Loyalty Metrics with Formulas and Actionable Insights
IV. Product Performance & Optimization
Analyzing the performance of individual products is a critical activity for effective inventory management, strategic merchandising, and the continuous refinement of the product catalog.
Product List Views indicate the number of times a product list has been displayed to visitors within a specific section of an online store, including instances referred from search engines.17 This metric provides an initial gauge of interest in a particular category or collection.
Detail Views represent the number of times a visitor has clicked on a product detail page to gather more information about a specific product.17 A high number of detail views suggests a stronger intent to learn about a product, potentially signaling a buying intention.17
Product Addition (to cart) tracks whether a product has been successfully added to a visitor's shopping cart.17 This is a key indicator of conversion intent, showing that a customer has moved beyond browsing to consider a purchase.
Remove View (from cart) identifies products that were initially added to the shopping cart but subsequently removed by the visitor.17 This metric is vital for understanding why a particular product might not be converting into a completed sale. High removal rates suggest issues with the product itself, its pricing, or unexpected costs encountered during the cart review process.17 Such data provides clear direction for sellers on whether to improve or potentially discontinue a product.17
The Unique Purchase Views List incorporates several attributes for more detailed product performance analysis.17 The
Cart to Detail Rate compares the number of products added to the shopping cart relative to the product detail views. A higher rate suggests that the product's detailed views effectively influenced the customer's interest in purchasing.17 The
Buy to Detail Rate offers a more in-depth analysis by comparing the buying rate to the detail rate, indicating how many customers ultimately purchase a product after viewing its detail page.17 These rates collectively help determine a product's overall success and the effectiveness of its online presentation.17
Product Return Rate measures how many products are returned after purchase.3 The formula is: Total number of items returned ÷ by the total number of items sold × 100.8 The average return rate across industries typically falls between 20% and 30%.8 A high return rate can indicate issues with product descriptions, sizing accuracy, product quality, or a mismatch with customer expectations.3 Tracking the underlying causes of returns is essential for improving services and product quality.17
The Google Analytics Refund Tool is a free utility that assists in tracking refunds for multiple transactions.17 A large-scale refund rate, as identified through this tool, can strongly indicate customer dissatisfaction with the product's quality.17
Product performance analysis offers several key benefits, including a deep understanding of how customers interact with a product, reduced user churn, a clearer definition of the ideal customer, and an understanding of what drives user engagement.2
When a business observes a high "Remove View" 17 or a high "Product Return Rate" 8, it prompts an immediate inquiry into why customers are rejecting the product, either before or after purchase. These metrics serve as direct signals of a discrepancy between customer expectations—often shaped by product descriptions, images, or marketing—and the actual reality of the product, its fit, or its perceived value. A high "Remove View" might suggest a last-minute price shock, an inconvenient cart experience, or a change of mind, while a high "Return Rate" frequently points to issues with product quality, inaccurate descriptions, or sizing inconsistencies.8 This data provides a crucial feedback loop for product development, merchandising, and marketing strategies. It helps identify underperforming products that may require improvement or even discontinuation 17, facilitates the refinement of product descriptions 3, informs pricing adjustments, and aids in more accurate inventory planning.3 Ultimately, optimizing product performance directly impacts customer satisfaction, contributes to reduced churn 2, and enhances overall profitability.
V. Technical Performance & User Experience Metrics
A website or application that is fast, responsive, and consistently reliable is fundamental to delivering a positive user experience, which in turn directly influences conversion rates and sales.
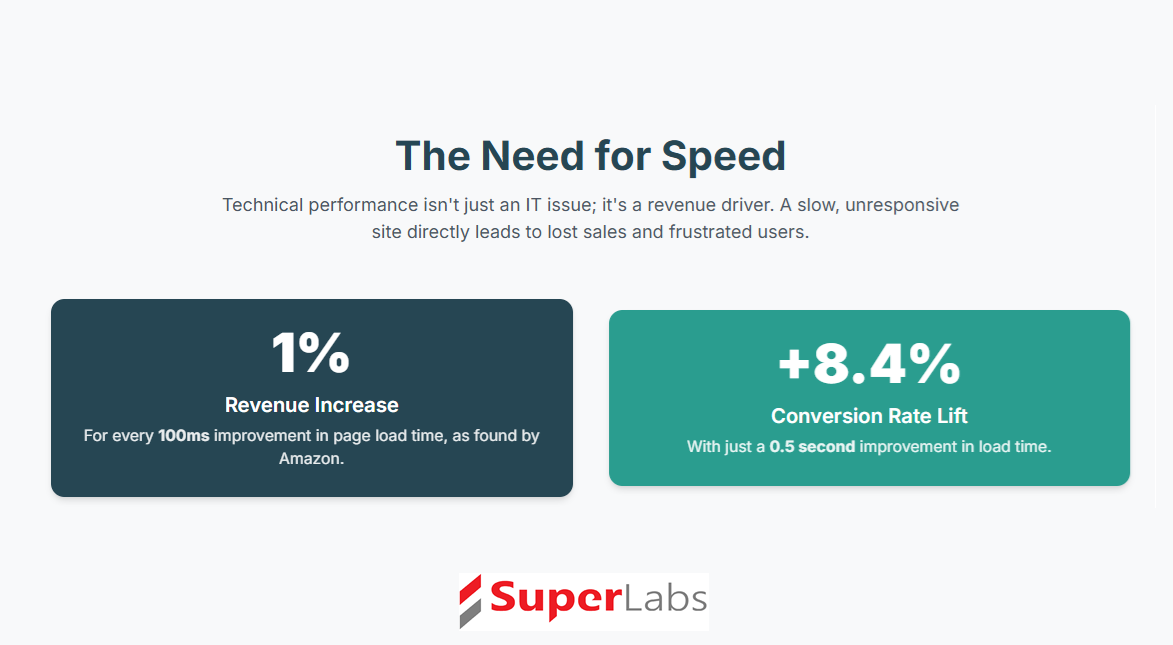
Website Performance is defined by the quality of a user's experience on a site, encompassing measures such as load time, responsiveness, and overall functionality across various devices, browsers, and geographical locations.9 Research indicates that a fast and responsive website can significantly boost conversion rates and sales.18 For instance, Amazon observed a 1% increase in sales for every 100-millisecond reduction in page load time.18
Server Response Time, often measured as Time to First Byte (TTFB), quantifies the duration it takes for a web server to begin loading a webpage after a user's request, or for a browser to receive the very first byte of information from the server.9 This metric provides an approximation of the backend server's performance from the end-user's perspective. A slow TTFB indicates a slow-loading site, negatively impacting overall performance.9 It can also reveal issues related to the server's geographical proximity to its end-users.18
Page Load Time measures the total duration from the moment a user initiates a page load (e.g., by clicking a link or typing a URL) until the complete webpage is fully rendered in the browser.18 Longer load times are directly correlated with user frustration and increased abandonment rates.18 Studies have shown that even a half-second improvement in page load time can lead to an increase in conversion rates.9
Page Load Size refers to the total size of a webpage's assets. Larger pages, particularly those with numerous large images, videos, or other multimedia elements, can take considerably longer to load, especially on slower internet connections.9 Optimizing the size of images, videos, and the overall page weight is crucial for improving load times.9
DNS Lookup Time is the time required to translate a domain name (like "Shopify.com") into its corresponding IP address, enabling the user's browser to locate and access the site's web server.9 Delays in this process can contribute to the overall page load time.18
Code Quality, specifically the presence of excess or outdated code, can significantly impede a site's loading time.9 Web developers strive to minimize and optimize inefficient code and markup to ensure faster loading.9
Browser Compatibility is essential, requiring web pages to be optimized for correct display and functionality across a variety of browsers and devices.9 This is particularly important for mobile users, who constitute over 50% of all e-commerce traffic, as mobile-optimized websites load faster and provide a superior experience.9
Uptime represents the percentage of time a website is operational and accessible to users. Downtime directly translates to lost sales and can severely damage a brand's reputation.9 Reputable hosted platforms, such as Shopify Plus, aim for high uptime percentages, often achieving 99.99%.9
Core Web Vitals are a set of specific metrics introduced by Google that measure the quality of a user's page experience.18 These include:
- Largest Contentful Paint (LCP): Measures how long it takes for the main content of a page to load on the screen. An LCP of 2.5 seconds or less is considered good, while 4 seconds or more indicates a poor experience.18
- Cumulative Layout Shift (CLS): Measures the visual stability of a website, specifically how much elements shift around as the page loads. A CLS of 0.1 or less is recommended.18
- First Input Delay (FID): Measures how quickly a user can begin interacting with a website, even if it is still loading. A FID of 100 milliseconds or less is advisable, while over 300 milliseconds can lead to a degraded experience.18These metrics directly impact user experience and contribute to search engine optimization (SEO) rankings.18
Lighthouse Scores provide automated reports on web page quality across several categories (Performance, Accessibility, SEO, Best Practices, PWA) and offer suggestions for improvement.18 These scores are important indicators of how search engines like Google might evaluate a site for ranking purposes.18
Other critical Page Load Metrics include Server Connection Time, Establish SSL/TLS Time, HTML Download Time, Render Time, Request Count, and various Transfer Sizes (HTML, Image, CSS, Font, JS, JSON, Video), as well as Javascript Error Count.18 These provide a detailed breakdown of the loading process, enabling the identification of specific bottlenecks.18
The consistent observation is that technical metrics such as Page Load Time 18, Server Response Time (TTFB) 9, and Core Web Vitals 18 are not merely "IT problems" but possess a direct, quantifiable impact on business outcomes. For example, Amazon's finding of a 1% sales increase for every 100-millisecond reduction in page load time 18 clearly demonstrates that even seemingly minor technical enhancements can yield substantial revenue gains. A slow website inevitably leads to higher bounce rates 3, increased cart abandonment 3, and ultimately, reduced conversion rates.3 Furthermore, inadequate browser compatibility 9 alienates mobile users, who constitute the majority of e-commerce traffic. This underscores that technical performance is not a secondary consideration but a fundamental driver of profitability and customer satisfaction. Disregarding these metrics results in missed revenue opportunities and an elevated risk of customer churn due to frustrating user experiences. It emphasizes the imperative for continuous monitoring 4 and strategic investment in robust hosting solutions 9 and code optimization.
Table 4: Critical Website Technical Performance Indicators & Impact
VI. Advanced Analytics: From Data to Strategic Action
Beyond basic reporting, advanced analytics empowers highly targeted strategies and fosters continuous optimization, transforming raw data into a competitive advantage.
A. Audience Segmentation
Audience segmentation involves dividing a customer base into distinct, meaningful groups based on shared characteristics such as demographics, purchasing habits, geographic location, or psychological factors like values and interests.10
The benefits of this approach are substantial: it enables the delivery of highly targeted promotions, significantly improves conversion rates, deepens customer trust and loyalty, aids in identifying the most valuable customers, contributes to an increased Average Order Value (AOV), and drives repeat purchases.1
Key segmentation strategies, particularly those based on data and user behavior (often referred to as CRM segmentation), include:
- Based on Past Purchase Behavior: This involves analyzing existing customers' historical purchase data and online interactions to categorize them into sub-groups like "price-conscious," "need-proof," or "risk-averse".15 For example, a business selling dog food might send reminders to price-conscious customers at the beginning of the third week (knowing a bag lasts about three weeks) or offer bundles on related products.15
- Based on Browsing History: This strategy tracks the behavior of registered browsers, observing repeat visits and prolonged browsing sessions.15 Such behavior often indicates genuine interest in products. To encourage these "serial browsers" to make their first purchase, businesses can offer special discounts for initial orders or run remarketing campaigns based on the categories and products they have viewed.15
- Based on Cart Abandonment: This addresses customers who add items to their cart but do not complete the purchase.10 While interruptions can cause abandonment, factors like unexpected shipping fees or a realization that the product doesn't meet needs are also common. Re-engagement strategies include automated recovery emails with low-stock warnings or special checkout discounts, and simplifying the checkout process.10
- Returning Customers / Loyal Customers: This segment comprises customers who have made repeat purchases, demonstrating trust in the brand.10 These customers are valuable not only for consistent revenue but also for their potential to recommend products. Strategies to maintain their loyalty include points programs, unique offers, discount tiers, and early access to new products.10
- New Customers: These are first-time buyers or recent platform joiners.10 AI-driven personalization can create custom-tailored welcome experiences, automate onboarding with engaging tutorials, or highlight best-sellers to demonstrate the brand's value.10
- High Spenders: This group includes customers with above-average purchase values.10 Identifying them early through predictive analytics allows for exclusive VIP perks or early access to premium collections, encouraging continued high-value purchases.10
- Frequent Users: These customers interact regularly with the platform.10 They are ideal candidates for cross-sell and upsell opportunities, with real-time behavioral tracking providing hyper-relevant product recommendations.10
- "Window" Shoppers / Idle Users / Churned Customers: These categories include browsers who rarely buy, previously active but now inactive customers, or those who have completely stopped purchasing.10 Dynamic retargeting ads, automated re-engagement campaigns, and personalized win-back strategies are employed to reignite their interest.10
- Content Marketing Leads: This strategy converts readers from newsletters, blogs, or guides into customers.15 It involves sending updates on new products, special offers, and providing insider tips, subtly including products within relevant content.15
- Other segmentation criteria include Demographic Segmentation (age, gender, income) 10,Geographic Segmentation (country, city, climate) 10,Purchase Frequency, Average Order Value, Product Category Preferences, Seasonal Shoppers, Email Engagement, Customer Journey Stage, Psychographic, Technographic, Weather-Based, and Profession or Industry.10
Tools commonly used for segmentation include Google Analytics 12, Peel 21, UXCam 11, CRM systems, email marketing software, and social media analytics.7
While segmentation allows for the tailoring of messages 10, the evolution of analytics extends beyond basic demographic or geographic groupings to embrace behavioral and psychographic segmentation.10 This is based on real-time interactions and comprehensive purchase history.4 This granular understanding facilitates "hyper-targeted messaging" 21 and "personalized offers".4 When marketing communications deeply resonate with individual customer needs and interests, it significantly boosts engagement, elevates conversion rates, and strengthens customer loyalty.1 This approach transcends mere product sales, fostering deeper customer relationships.1 In a highly competitive e-commerce market 14, personalization 1 emerges as a key differentiator. It not only optimizes marketing expenditure 1 but also enhances the overall user experience, making customers feel valued and understood, which in turn drives repeat purchases and advocacy.1
Table 5: E-commerce Customer Segmentation Strategies & Examples
B. Data Utilization Best Practices
Effective utilization of analytics data necessitates strategic planning, the deployment of appropriate tools, and a steadfast commitment to continuous improvement.
Data-Driven Decision Making involves translating numerical data into actionable strategies that propel businesses ahead of the competition.1 This approach ensures that business choices are founded on empirical evidence rather than conjecture.
Leveraging Historical Data serves as a vital roadmap for future strategies, revealing past successes and failures, and providing context for current trends.1 This retrospective analysis allows for the fine-tuning of offerings, marketing strategies, and customer service approaches.
A/B Testing is an iterative process critical for validating different approaches and ensuring that strategic decisions are evidence-based.1 It allows for direct comparison of various elements to determine which performs optimally.
Real-time Analytics are crucial for facilitating immediate actions, such as fraud detection, addressing checkout issues, implementing dynamic pricing, and issuing stock-level alerts.4 Data frequency can be tiered: immediate action (seconds/minutes), quick needs (minutes/hours), and strategic insights (daily/extended intervals).4 This tiered approach ensures that resources are allocated efficiently, with high-frequency monitoring reserved for critical areas like revenue or customer experience where immediate adjustments are vital.4
Dynamic Ad Spending involves scaling advertising investments dynamically based on real-time user engagement, thereby maximizing return on investment.4 Similarly,
Dynamic Pricing allows for real-time adjustments to product prices based on user behavior and purchase rates, optimizing sales performance and competitiveness.4
Stock-Level Alerts promptly notify customers about low stock levels on popular items, driving immediate purchases and preventing stockouts.4
Personalization and Customer Journey Optimization are achieved by leveraging data analytics to offer tailored experiences at every customer touchpoint, making each interaction more relevant and engaging.1 This approach drives conversions and cultivates loyalty by making customers feel valued and understood.
Defining Strategic Objectives involves setting clear goals for leveraging analytics, whether it is to enhance marketing effectiveness, refine user experiences, or improve operational efficiencies.4
It is also essential to Define Key Metrics that directly impact business goals. These include financial metrics (revenue, conversion rates, AOV), operational metrics (inventory turnover, fulfillment speed), marketing metrics (click-through rates, campaign effectiveness), customer service metrics (response times, return rates), and customer behavior metrics (interactions, engagement levels, sales volumes).4
To implement these practices, businesses must Select Appropriate Tools capable of handling real-time data at scale and integrating seamlessly with existing technology stacks.4 Examples of such tools include Google Analytics 12, UXCam 11, ZIK Analytics 23, Peel 21, Mouseflow, Mixpanel, Glassbox, Woopra, Heap, Kissmetrics, Beacon by Stackline, CartInsight, Profitero, Triple Whale, Hotjar, Matomo, Supermetrics, Optimizely, and Adobe Analytics.20
Furthermore, it is critical to Integrate Data Sources, connecting web traffic, transactions, customer interactions, and inventory levels to the analytics platform to gain comprehensive insights.4 Developing
Data Visualization through dynamic dashboards that update in real-time facilitates quick understanding and action by stakeholders across the organization.4 Finally,
Automating Decision Processes based on real-time insights—such as dynamic pricing adjustments or personalized content delivery—enhances agility.4 Throughout this process, ensuring
Data Quality through regular audits and maintenance is paramount to uphold the reliability of real-time insights.4
The challenge in e-commerce analytics is not merely the collection of data, but the effective integration of disparate sources 4 and processing it at the appropriate frequency.4 When data from web traffic, transactions, customer interactions, and inventory 4 are integrated and analyzed in real-time, it enables highly agile responses. Dynamic pricing and stock alerts 4 can prevent stockouts 3 and optimize sales. Real-time campaign adjustments 4 maximize ROI. This integration provides a holistic view of the customer journey, facilitating proactive interventions and personalized experiences.1 This level of data utilization transforms e-commerce operations from reactive to highly responsive and predictive. It allows businesses to optimize every aspect of their operations, from marketing expenditure to inventory management, leading to significant competitive advantages and sustained growth.1
C. Overcoming Common Analytics Challenges
While the benefits of e-commerce analytics are immense, their effective implementation and leveraging often encounter several common challenges.
One significant challenge is Deciding Which Metrics Matter Most. With an abundance of available data, it is easy to clutter reports with unnecessary details.26 The solution lies in focusing on Key Performance Indicators (KPIs) that are directly aligned with core business goals, such as improving conversion rates or boosting repeat purchases.26
Data Quality Issues frequently arise from incomplete, inaccurate, or inconsistent information.25 To overcome this, businesses should implement robust quality assurance checks, utilize multiple data sources to cross-verify information, and conduct regular reviews and analyses to identify inconsistencies and potential biases. Triangulating results from different sources can further ensure the scientific validity of findings.25
Protecting Sensitive Customer Data is a crucial challenge, particularly in e-commerce where personal and financial information is handled. Adherence to legal compliance and industry-specific protocols is essential to avoid legal and ethical issues and to build customer trust.25
Integrating Third-Party Data while maintaining the integrity of raw data from various sources can be complex.25 This requires careful planning and robust data connectors to ensure seamless and accurate data flow.
Underestimating Costs associated with data collection is another common pitfall. Adequate budgeting for equipment, personnel, training, and unexpected expenses is crucial. Underestimation can lead to incomplete or inaccurate datasets that are not valid for business decisions.25
A Lack of Effective Communication among stakeholders and team members can exacerbate cost underestimation and result in resource shortages mid-project.25 Clear communication channels and collaborative planning are therefore essential.
Reaching the Right Users or attracting "qualified traffic" is a persistent challenge. Casting too wide a net in marketing efforts wastes ad spend and can skew analytics with visitors who do not convert.14 The solution involves refining targeting strategies using first-party data (from past purchases or onsite behavior), segmenting audiences, developing detailed buyer personas, and auditing top-performing traffic sources to align with the ideal customer base.14
Converting More Visitors into Customers is often hindered by friction points in the user journey.14 To address this, businesses should optimize product pages for clarity, speed, and usability. This includes incorporating strong calls to action, high-quality images, real-time inventory indicators, and clear shipping policies. Conducting A/B tests on key elements like headlines, button placement, and checkout flow can identify what works best. For visitors who abandon carts, strategies like offering guest checkout options, simplifying forms, or launching retargeting campaigns can bring them back.14
Finally, Increased E-commerce Competition creates a crowded digital landscape, leading to thinner margins, higher acquisition costs, and weaker brand loyalty.14 To stand out, businesses must emphasize their unique differentiators, whether it is exceptional service, personalized experiences, ethical sourcing, or faster fulfillment. Investing in brand storytelling across channels and automating operational tasks can also free up resources for strategic growth.14
The frequent mention of data quality issues—such as incomplete, inaccurate, or inconsistent information 25—and integration challenges 25 highlights a fundamental concern. Poor data quality inevitably leads to flawed analytical conclusions, which in turn result in misguided strategies and wasted resources. If, for example, a conversion rate is based on inaccurate visitor numbers, or Customer Lifetime Value (CLV) is distorted by incomplete purchase histories, any decisions derived from such data will be unreliable. This undermines confidence in analytics and can lead to significant strategic missteps. The emphasis on "clean data" 3 and the implementation of "quality assurance checks" 4 underscore that the reliability of data is as crucial as its availability. Businesses must invest in robust data governance, meticulous collection processes, and comprehensive integration strategies to ensure their analytical findings are trustworthy. Without this foundational data integrity, even the most advanced analytics tools become ineffective, making this a primary challenge that must be addressed before any deeper understanding can be truly actionable.
Conclusion: The Future-Proof E-commerce Business
Mastering e-commerce analytics is an ongoing journey characterized by continuous data-driven improvement and innovation. By systematically tracking core financial, customer journey, customer retention, product performance, and technical metrics, businesses can gain unparalleled clarity into their operations and customer base. The strategic ability to segment audiences, leverage real-time data, and proactively address common analytical challenges ensures that the derived understandings are not merely theoretical constructs but translate into tangible, measurable results. In an ever-evolving digital marketplace, a steadfast commitment to sophisticated analytics serves as the cornerstone for sustained growth, the delivery of enhanced user experiences, and the cultivation of a truly future-proof e-commerce business.
Works cited
- Ecommerce Analytics: Unveiling Tools and Strategies for ... - Netguru, accessed July 5, 2025, https://www.netguru.com/blog/ecommerce-analytics
- A Guide to Product Performance Analysis | Jarmany Blog, accessed July 5, 2025, https://www.jarmany.com/what-we-think/blog/a-guide-to-product-performance-analysis/
- Essential Ecommerce Metrics for 2025 Success - Supermetrics, accessed July 5, 2025, https://supermetrics.com/blog/ecommerce-metrics
- Ecommerce Insights and Best Practices: Real-Time Analytics ..., accessed July 5, 2025, https://www.madewithintent.ai/articles/ecommerce-insights-and-best-practices-real-time-analytics
- Top 75 Ecommerce KPIs to track in 2025 for Business Growth ..., accessed July 5, 2025, https://www.sarasanalytics.com/blog/ecommerce-kpi
- Ecommerce KPIs: Formulas, Benchmarks and Tips | NetSuite, accessed July 5, 2025, https://www.netsuite.com/portal/resource/articles/ecommerce/ecommerce-kpis.shtml
- Ecommerce Sales Funnel Essentials: Stages, Metrics, and How To ..., accessed July 5, 2025, https://www.mida.so/blog/ecommerce-sales-funnel
- 15 Ecommerce Metrics to Track for Success - Plytix, accessed July 5, 2025, https://www.plytix.com/blog/10-ecommerce-metrics-to-track-and-measure
- Website Performance: What It Is & How To Assess (2024) - Shopify, accessed July 5, 2025, https://www.shopify.com/enterprise/blog/website-performance
- 25 Examples of Customer Segmentation for E-Commerce - Nogin, accessed July 5, 2025, https://www.nogin.com/blog/examples-customer-segments/
- Top 5 Ecommerce Funnel Metrics and How to Analyze Them - UXCam, accessed July 5, 2025, https://uxcam.com/blog/ecommerce-funnel-metrics/
- Ecommerce Analytics: The Best Data to Collect - Crazy Egg, accessed July 5, 2025, https://www.crazyegg.com/blog/ecommerce-analytics/
- 14 customer retention metrics to track & how to measure them, accessed July 5, 2025, https://www.appcues.com/blog/customer-retention-metrics
- 12 Top Ecommerce Challenges and How to Master Them | NetSuite, accessed July 5, 2025, https://www.netsuite.com/portal/resource/articles/ecommerce/ecommerce-challenges.shtml
- Essential Ecommerce Customer Segmentation Strategies, accessed July 5, 2025, https://targetaudience.co/blog/essential-ecommerce-customer-segmentation-strategies/
- Ecommerce Customer Retention Rate: Definitions, Formulas and ..., accessed July 5, 2025, https://loyaltylion.com/blog/customer-retention-rate
- How to Analyze Product Performance Using Google Analytics ..., accessed July 5, 2025, https://www.sarasanalytics.com/blog/product-performance-product-return-refund
- Website Performance Metrics | An Actionable Guide - Cronitor, accessed July 5, 2025, https://cronitor.io/guides/website-performance-metrics
- How to Use Google Analytics for Ecommerce (2025) - Shopify, accessed July 5, 2025, https://www.shopify.com/blog/14681601-google-analytics-for-ecommerce-a-beginners-guide
- Top 9 Ecommerce Analytics Tools To Try In 2025 - SellersCommerce, accessed July 5, 2025, https://www.sellerscommerce.com/blog/top-ecommerce-analytics-tools/
- Ecommerce Analytics Guide: Tools and Strategies | Peel Insights, accessed July 5, 2025, https://www.peelinsights.com/post/ecommerce-analytics-guide
- Analytics Tools & Solutions for Your Business - Google Analytics, accessed July 5, 2025, https://marketingplatform.google.com/about/analytics/
- ZIK Analytics: Shopify & eBay Analytics Tools, accessed July 5, 2025, https://www.zikanalytics.com/
- 20 Best Ecommerce Analytics Software For Trend Analysis In 2025 | The Retail Exec, accessed July 5, 2025, https://theretailexec.com/tools/best-ecommerce-analytics-software/
- Common Challenges You Face With Data Collection, accessed July 5, 2025, https://www.atltranslate.com/ai/blog/common-data-collection-challenges
- supermetrics.com, accessed July 5, 2025, https://supermetrics.com/blog/ecommerce-reporting#:~:text=One%20big%20challenge%20is%20deciding,to%20track%20every%20possible%20number.
- 13 Ecommerce Challenges and How To Overcome Them (2024) - Shopify, accessed July 5, 2025, https://www.shopify.com/blog/ecommerce-challenges